Step 4- Reliability checks
In this step of the tutorial we will see how to obtain an H/V spectral ratio curve, and a peak, that are sufficiently reliable.
You can load the file "Step_3" inside the tutorial folder, which contains the data needed to proceed from this point of the tutorial onwards.
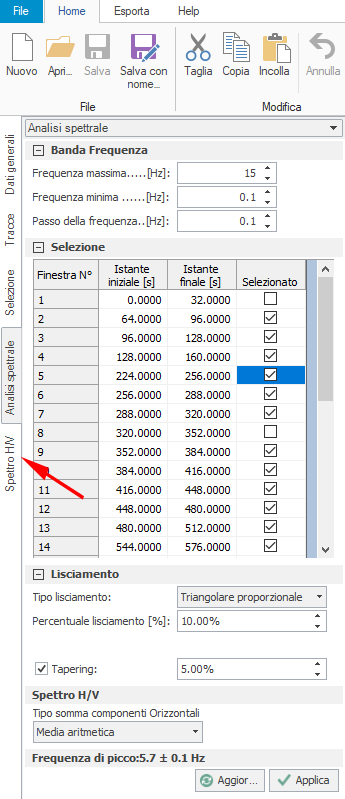
- First of all click on the tab named "H/V Spectrum" as shown in the figure
- The first thing to notice is the indication that some checks have not been passed, as shown in the figure
These are checks suggested by the SESAME project to assess the reliability of the H/V spectral ratio curve and of its peak. In this example the checks relating to the peak of the curve are not satisfied, since the standard deviation is excessive. These checks may also be disregarded: it is up to the user alone to decide whether to take them into account or ignore them. For the completeness of the tutorial, in this case we decide to consider them, trying to bring the results in line with those expected by the SESAME project.
-
The first of the two failed checks tells us that the peak of at least one of the two standard deviation curves lies at a relative distance in frequency greater than 5%. The operations that can be carried out to fall back within this limit are: removing windows that "disturb" the average too much, or changing the way the directional spectra are summed. The directional sum of the spectra can in fact amplify the spectral ratio and its standard deviation more strongly, producing a peak that is not very distinct. For the purposes of this tutorial we will try both solutions.
-
Let us go back to the tab named "Spectral analysis", and focus once again on the stationarity map. At the peak frequency of the H/V spectral ratio curve, the presence of some spectra with pronounced content can be noticed (see figure below).

It can also be noticed that in the highlighted area there is a strong variability of the spectra. By excluding the corresponding windows from the overall analysis, the standard deviation of the H/V spectral ratio can be reduced. To remove the above windows simply proceed as illustrated in the previous step of the tutorial, obtaining the following results:
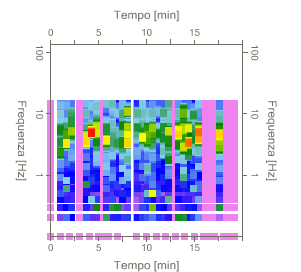
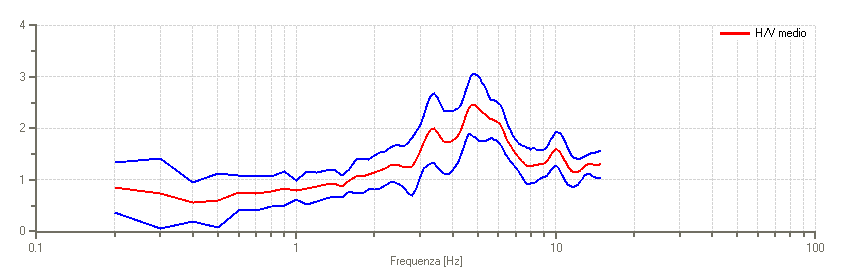
The removed windows are those with the following start instants: 960, 992 and 1024.
Switching to the tab named "H/V Spectrum", you will see that all the checks are now passed.
-
As mentioned before, we will now simply change the type of directional sum. Let us go back to the tab named "Spectral analysis".
-
Press "Undo" in the main menu: this brings us back to the previous condition, in which the three windows just excluded had not been excluded.
-
Change the type of directional sum, set it to "Arithmetic mean" and press "Update". Switching to the tab named "H/V Spectrum", we can see that all the checks are satisfied. In this case changing the directional sum worked because the difference that caused the check to fail was minimal. In such a situation this kind of choice is indeed preferable to discarding windows, since in the latter case we would have further reduced the data useful for the computation, whereas by changing the type of directional sum we have simply opted for one of all the possible choices, which does not affect the result in any way and merely represents one of the possible ways of summing the spectra in the horizontal directions.
©Geostru