Easy HVSR
Easy HVSR allows the analysis of the microtremor spectral ratio with single-station recordings. Its ease of use and the speed of the calculations make it possible to obtain immediate results in estimating: resonance frequency, stratigraphic profile, and equivalent shear-wave velocity Vs,eq. All of this follows the guidelines suggested by the SESAME project. The software imports SEG2, SAF, and ASCII files.
Customizing the analysis
You can choose the various ways in which the data are processed, selecting the most suitable methods for the directional sum of the traces in the horizontal directions, for data smoothing, and for the frequency band to be analysed.
Among the available directional sums you can in fact choose from the simplest arithmetic mean to the quadratic or geometric mean. Among the data smoothing methods suggested by the SESAME project, you can choose: Konno & Ohmachi (1998), Constant triangular, and Proportional triangular. You can choose which time windows to include and exclude simply by ticking a checkbox, seeing the variations resulting from the changes in real time. All of this is supported by the ability to filter the input data automatically.
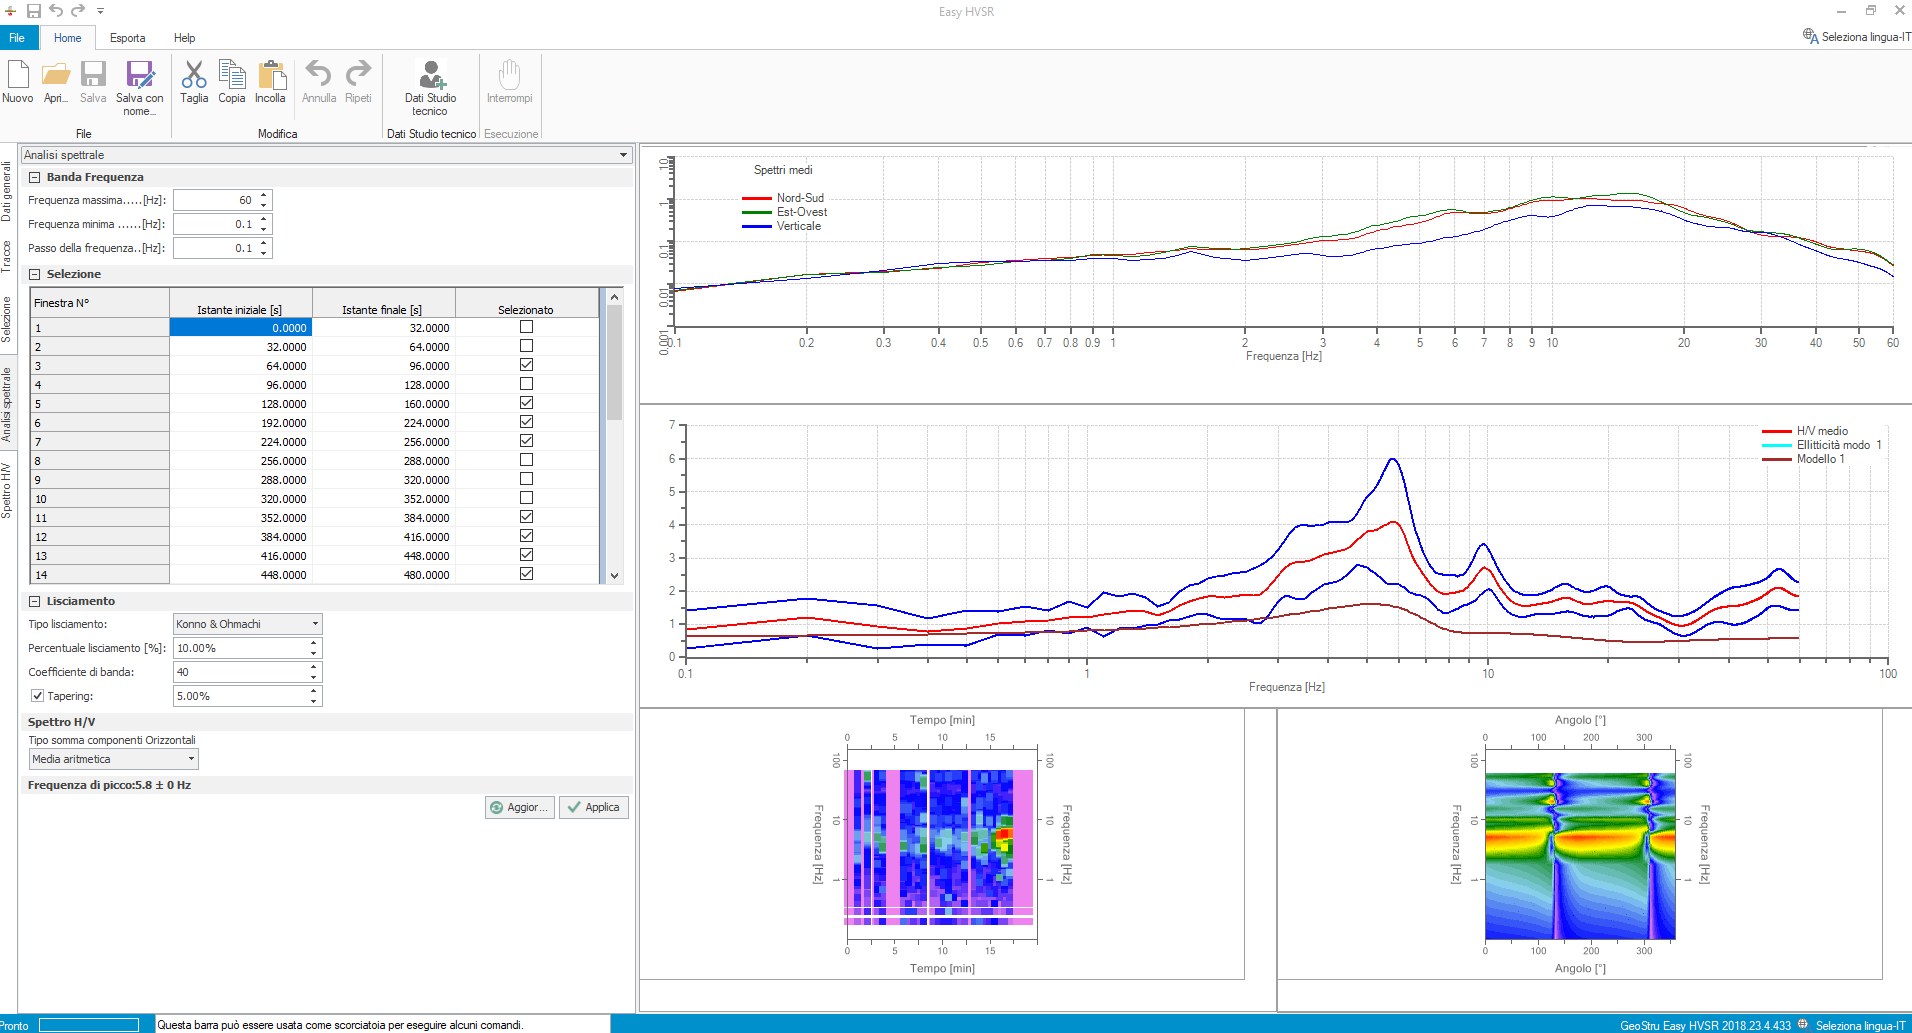
Data visualization
All results are represented in customizable charts. The available charts are: the traces in the three directions under analysis with the representation of the chosen time windows; the average spectrum of the traces; the map for checking the stationarity of the recording; the map for checking the directional isotropy of the recording; the H/V spectral ratio with its confidence interval, with the possible overlay of the ellipticity curve of several stratigraphic models, not only of the fundamental mode but also of the higher ones; the graphical representation of the stratigraphic profile; the velocity profile associated with the stratigraphy.
Results
It allows you to automatically evaluate a first estimate of the stratigraphic model that best approximates the H/V spectral behaviour recorded in situ and analysed, so that it can then be 'tuned' and refined more quickly. In this way, in addition to the natural vibration frequency of the stratigraphy typical of the HVSR technique, you obtain the immediate evaluation of the Vs,eq and of the shear-wave velocity profile of the assumed stratigraphic model. On the H/V spectral ratio chart you can therefore see, in addition to the H/V curve itself with its confidence interval, all the ellipticity curves of the various modes of each stratigraphic model that the user may decide to add. In this way, the differences can be compared from a qualitative point of view, and a quantitative comparison is also added with the estimate of the misfit function between the 'fundamental' ellipticity curve and that of the H/V spectral ratio. All of this is accompanied by the reliability checks on the H/V curve and its peak suggested by the SESAME project.
©Geostru