Step 2- Selecting the windows
In this step of the tutorial we will see how to select the time windows to be used in the processing.
You can load the file "Step_1" inside the tutorial folder, which contains the data needed to proceed from this point of the tutorial onwards.
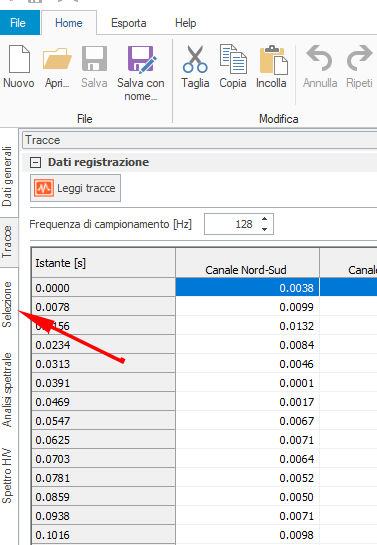
- Click on the selection tab
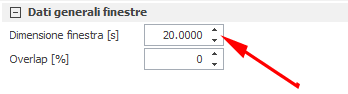
- In the section named "General window data" (following image) you can enter a value for the duration of the windows into which the whole recording is to be divided (red arrow). In this tutorial we will leave this value unchanged for the moment, but for further details you can refer to the relevant section of this manual.
- In the section named "Automatic selection" you can change the values of the start and end time, which identify the portion of the recording that will be automatically divided into windows, through the procedure started by the button named "Select" highlighted in the following image

In this case we will use the whole recording, which has a duration of 1200 seconds (20 minutes).
- Right after performing the automatic selection you should obtain an on-screen image similar to the one shown in the following picture

-
In the three upper charts you can see how the automatic selection has divided the traces of the three channels into several recordings of length equal to the one entered in the "Window size" field discussed above. Each rectangle in those charts therefore represents one of the windows into which the whole recording has been divided. The central chart, on the other hand, shows the average spectra of each trace, averaged over the windows just generated.
-
Before manually selecting the windows to be included in or excluded from the analysis, it is convenient (but not always necessary or appropriate) to apply the filter function, in order to discard those windows containing recordings of transients.

To tune the parameters of this section we recommend reading the relevant information contained in this guide regarding the filtering technique. Strictly for the purposes of this tutorial, we will enter the value 8 in the field named "Control window size". Then, pressing the button named "Filter", the result is the following:
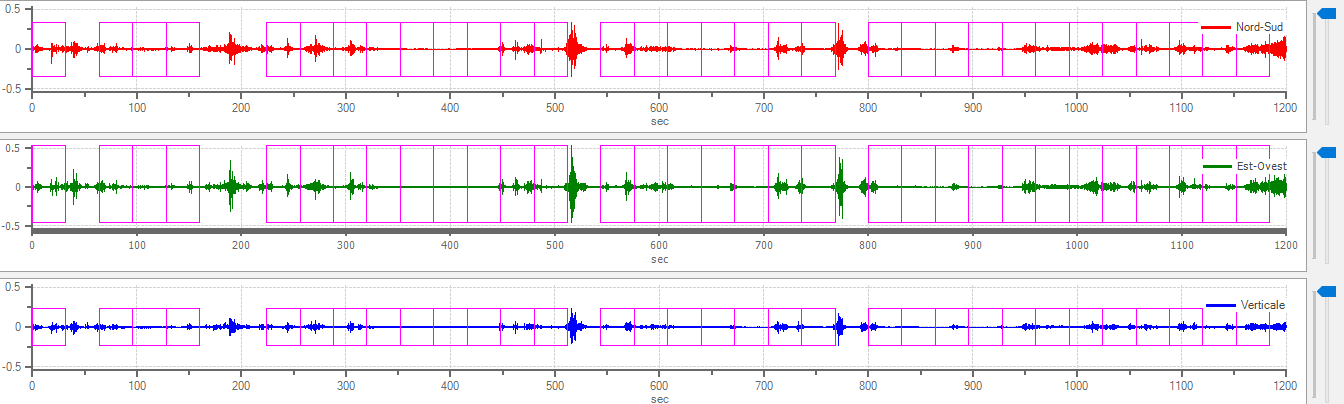
In practice the time window containing the recordings from second 512 to second 544 has been discarded, because the procedure identified peaks to be considered unsuitable for the computation.
- Even though the automatic procedure is effective, it is sometimes necessary to refine the result manually, discarding those time windows in which peaks are clearly present that cannot be considered representative of an undisturbed condition of the environment where the recording was carried out. In fact, the presence of industrial machinery or the passage of vehicles near the recording point alters the ideal condition of the investigated site. For this reason it is preferable to remove these peaks, which would make the analysis difficult if not altogether unreliable. Those windows considered "disturbed" are therefore identified. In our case, the windows that should be further discarded are those approximately around 50, 180 and 780 seconds. Clicking inside the relevant window of any trace chart highlights that window, and in the window table the associated row containing the start and end instant of the window is highlighted.
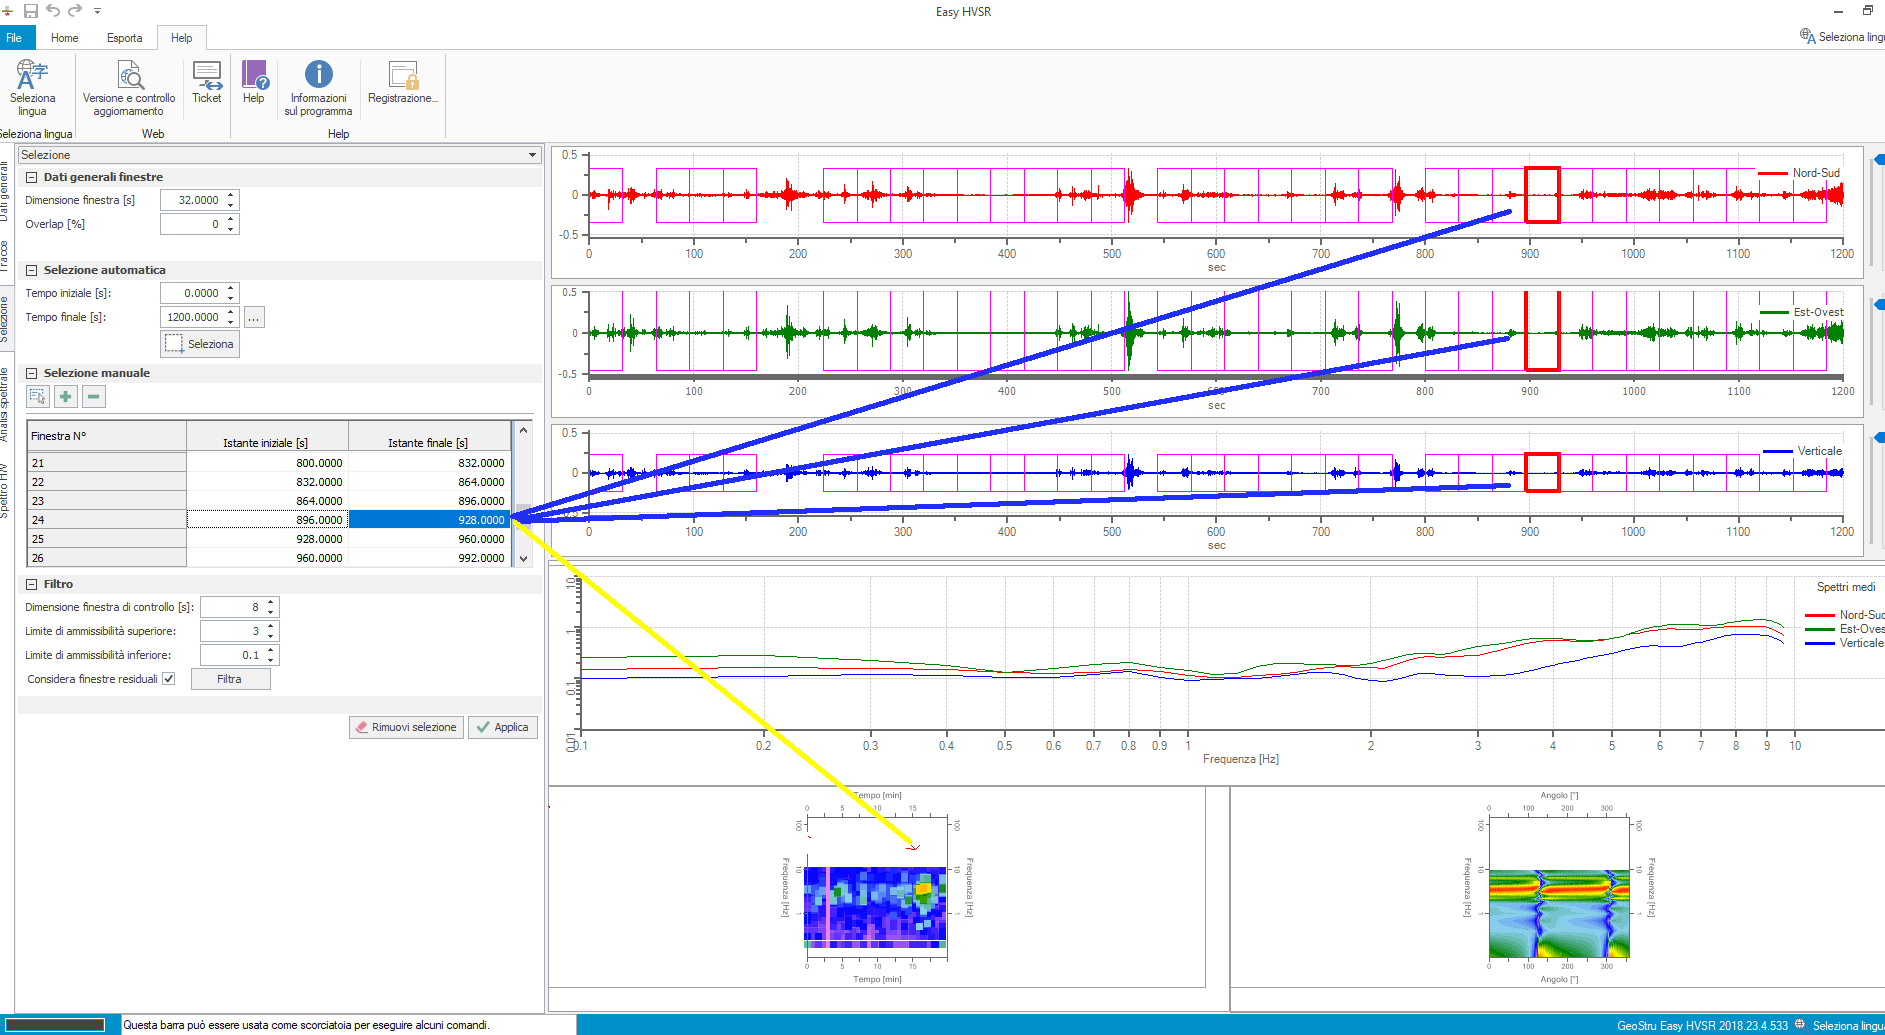
In the image above the blue arrows highlight the correspondence between the table and the selected window, while the yellow one shows the correspondence between the table and the stationarity map, which shows the trend of the H/V spectral ratios of the windows placed side by side in chronological order. This last map will be analysed and used in the following steps of the tutorial, where its great usefulness will be illustrated.
- Once the window has been selected in the table, also through graphical synchronisation, the button with the icon

, named "Remove", makes it possible to discard the selected window from the analysis. Proceeding in the same way for the other two windows mentioned above, we obtain the following result:
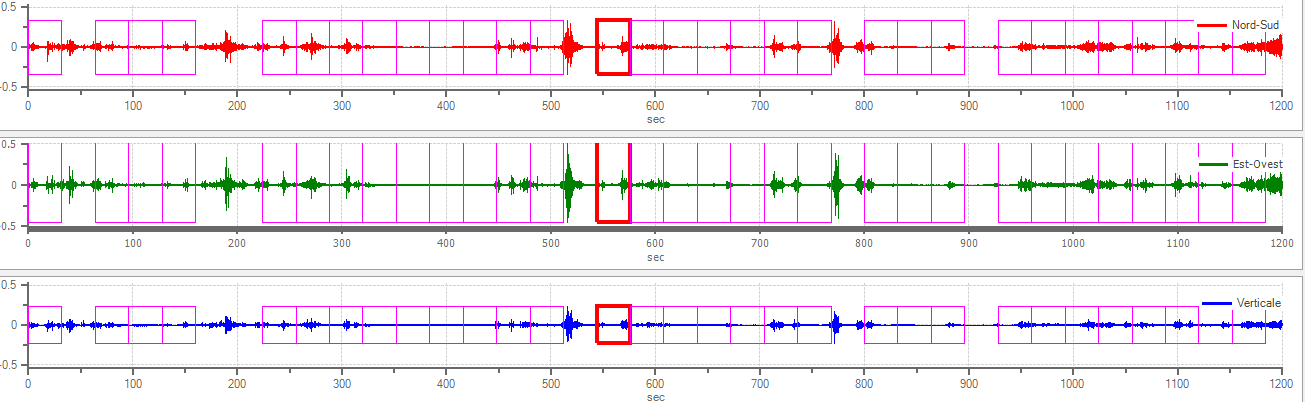
- If we had deleted a window by mistake, or if we wanted to add one manually, there are two possible procedures.
The first involves manually entering the start time of the signal portion, through the dialog window that appears when pressing the button named "Add" with the icon 
.
The other procedure involves entering it directly on the chart. Clicking the button named "On the chart", with the icon 
, and clicking and holding the left mouse button on one of the trace charts, produces a selection similar to the one shown in the following picture:
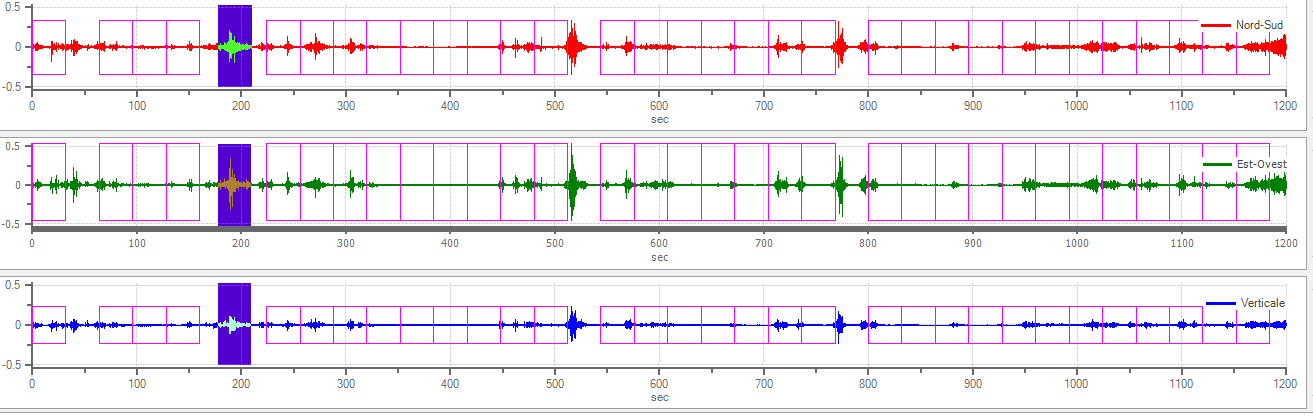
While holding the mouse button down, you can move along the abscissa direction of the traces and a coloured rectangle follows the mouse pointer, showing where the time window that will be added on releasing the button would be placed.
- Once this is done, press the button named "Apply" and save the work carried out so far.
©Geostru