Groundwater table
The WATER TABLE tab collects everything about groundwater: the number of water tables and the active one, the vertices, piezometers, piezometric lines for each layer, and the Pore pressures group (Grid and ru, Seepage, Rapid drawdown).
Watch the video
The Water table tab is the second chapter of the video tutorial Seepage, pore pressures and rapid drawdown.

Pore pressure from the water table
Below the water table Slope computes the pore pressure at the base of each slice on the vertical:
where h is the height of the water table above the base of the slice. The pressure is zero in materials that are not permeable: this is the Permeability tick of the Geotechnical properties (the same as the Pore pressures in stability (permeable) column of the Seepage window). With No. of GWT = 0 the slope is dry.
Where the water table is above the ground the water is free (a reservoir, a lake, a river): Slope applies it as external water load on the submerged slices.
The drawn water table is the simplest source of pore pressure. If the u(x,y) grid or the ru coefficient are active, they take priority: see Pore pressures.
Commands of the tab
The commands for managing the GWT are represented in the image below:

No. of GWT: This command gives the possibility to create (typing a number greater than one) the number of GWT corresponding to the number entered, or delete (by typing zero) all GWT previously created. Entering the number of GWT to create is activated the GWT window, where each GWT is indicated with an integer number.
Insert (GWT vertices): This command allows the definition of GWT by inserting the points with the mouse directly on the profile.
Delete (GWT vertices): This command activates all vertices - just click on the ones you want to delete. Right click to apply the modifications.
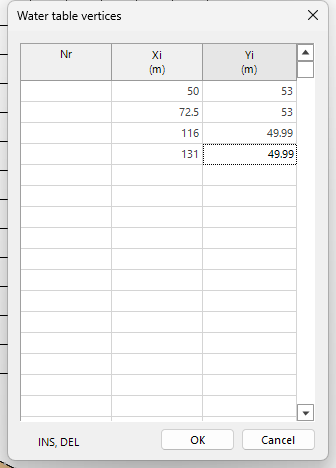
(GWT vertices) Table: This command opens a table where the vertices of the GWT can be managed. In the first column the vertices of the GWT are represented with integer numbers from 1 to n, the second and the third column contain the coordinates of the vertices with respect to the global reference system. If more GWT must be managed, a table is associated to each of them.

 To define the GWT at least three points are needed. |
|---|
In the vertex table type X and Y in the empty rows and press OK. INS inserts a row, DEL deletes it.
Water table to ground level: Translates the GWT at ground level, and the piezometric will coincide with the soil profile.
Translate water table in y: Translates the GWT along the y axis by inserting a number (bigger or smaller that zero) in the window below. For a value grater than zero the GWT is translated in upwards direction (towards the positive part of the axis), while for a value smaller than zero, GWT is translated in downwards direction (towards the negative part of the axis).

Drainage trenches: opens the data of the drainage trenches.
Piezometers: Often used to monitor the level of the GWT (responsible for pore pressures that act along the failure surface of the soil), the command allows the management of n piezometers. By assigning zero to this command, all piezometers previously defined will be deleted.
After assigning the number of piezometers to be used a window with a sequence of integer numbers is opened (numbers from 1 to n) to each number is associated a piezometer and to each piezometer is associated a table like the one in the image below.
 |
The table will contain a range of information, including: Description: the field can be used to describe the characteristics of the piezometer. Diameter, Length: These refer to the geometric dimensions of the measuring instrument. XYZ: These represent the coordinates of the insertion point (piezometer head) with respect to the global reference system. The first column of the table shows the ID to which the recording time (second column) and the water table level is associated (reading order is from top to bottom). Each piezometer corresponds to a table with its own characteristics. Translated with www.DeepL.com/Translator (free version) |
|---|---|
Find GWT levels: After inserting the piezometers this command allows interpolating the measuring points and draw a polyline that defines the level of groundwater.
In order for the Find GWT levels command to work properly it is necessary that each piezometer inserted has the same number of readings. |
|---|
Slope allows the management of water under pressure through the command Piezometric surf.

Piezometric surf. No.: From this command can be created the piezometrics (inserting a number greater than one) or they can be deleted (by typing zero all piezometrics previously created are deleted). Entering the number of piezometers that must be managed, two windows are activated: Piezometric surface / Assigned to layer no. from where the piezometric can be associated to a layer.

Insert (Piezometric vertices): This command allows the definition of the piezometric level by inserting the points with the mouse directly on the profile. While the vertices are inserted with the mouse a table for the vertices coordinates is filled in the right-side menu.

Delete (Piezometric vertices): This command activates all vertices of the chosen piezometric level - just click on the ones you want to delete. Right click to apply the modifications.
Example: a second water table with a low reservoir
Start from the Earth dam template with the default values: there is one water table, the reservoir at elevation 58.5 m.
- WATER TABLE tab → Table: you see the vertices of water table 1: (50; 58.5) (86.25; 58.5) (116; 49.99) (131; 49.99). Close with Cancel.
- No. of GWT → type 2 → OK.
- In the GWT drop-down choose 2: it is now the active water table. It is still empty, so the reservoir disappears from the drawing; water table 1 stays drawn in light blue.
-
Table: in the first four rows type the vertices (50; 53) (72.5; 53) (116; 49.99) (131; 49.99) and press OK.
-
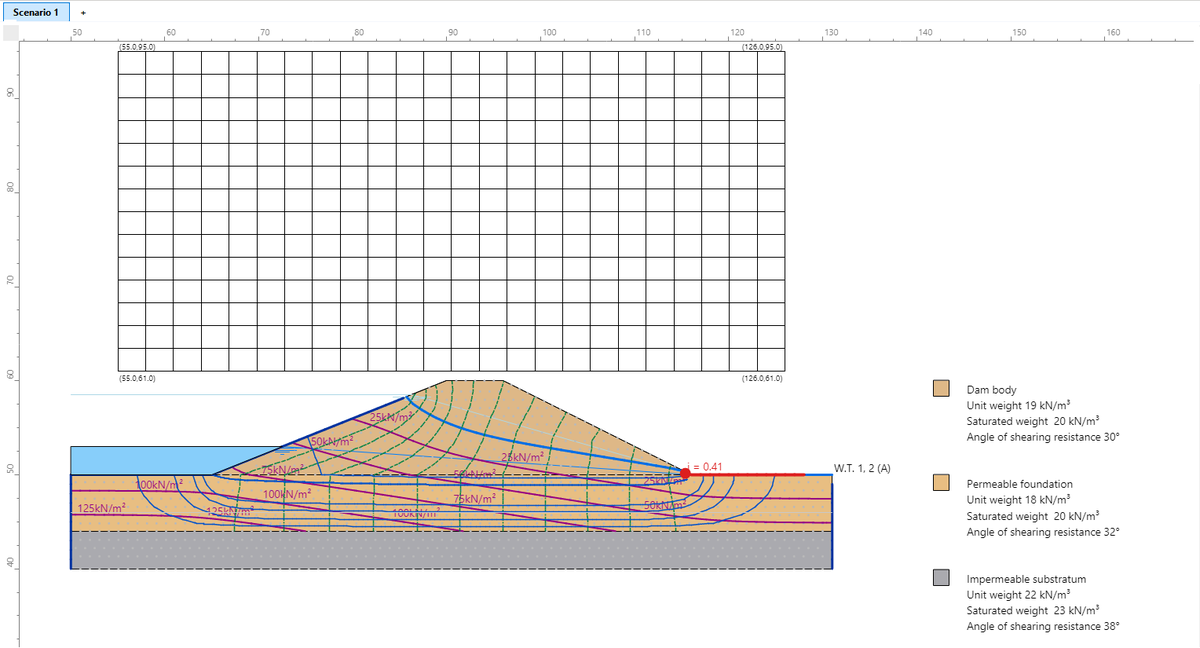
The drawing shows the low reservoir, at elevation 53 m. The label W.T. 1, 2 (A) marks two water tables ending at the same point; (A) is the active one.
-
In the GWT drop-down go back to 1 to restore the full reservoir.
The stability analysis always uses the active water table. The other water tables stay in the project: for example the water table after drawdown in the rapid drawdown check.
Pore pressures, seepage and rapid drawdown
The Pore pressures group of the WATER TABLE tab extends the water table with three tools (the Earth dam template sets them all up in one step):
- Grid and ru: pore pressure grid u(x,y), ru coefficient per material, cos²θ correction for inclined seepage;
- Seepage: steady-state finite element seepage, whose result becomes the pore pressure grid;
- Rapid drawdown: stability under rapid drawdown with the three-stage method of Duncan, Wright and Wong.