Results
At the end of the analysis (the equivalent nonlinear analysis is generally recommended in order to obtain the response spectrum), it is possible to view the results from the Analysis and results panel, "Plot results" button. In this way the mesh used to perform the analyses is displayed. By clicking on the "Show spectrum" text, the previously defined monitored nodes are displayed (see figure).
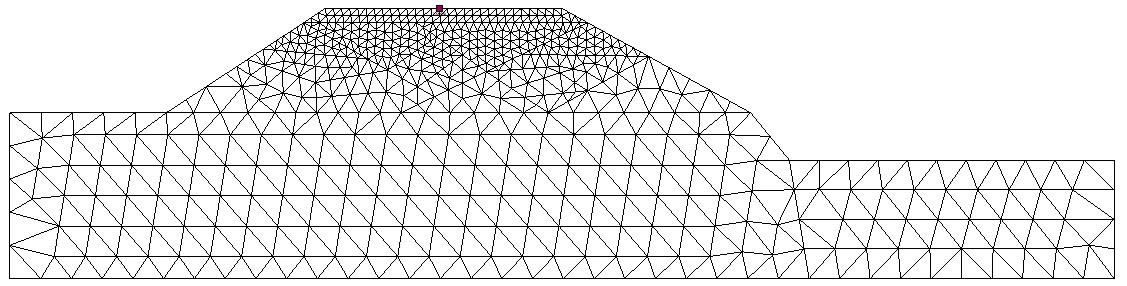
By clicking on the chosen node, the following window appears for the generation of the obtained spectra.
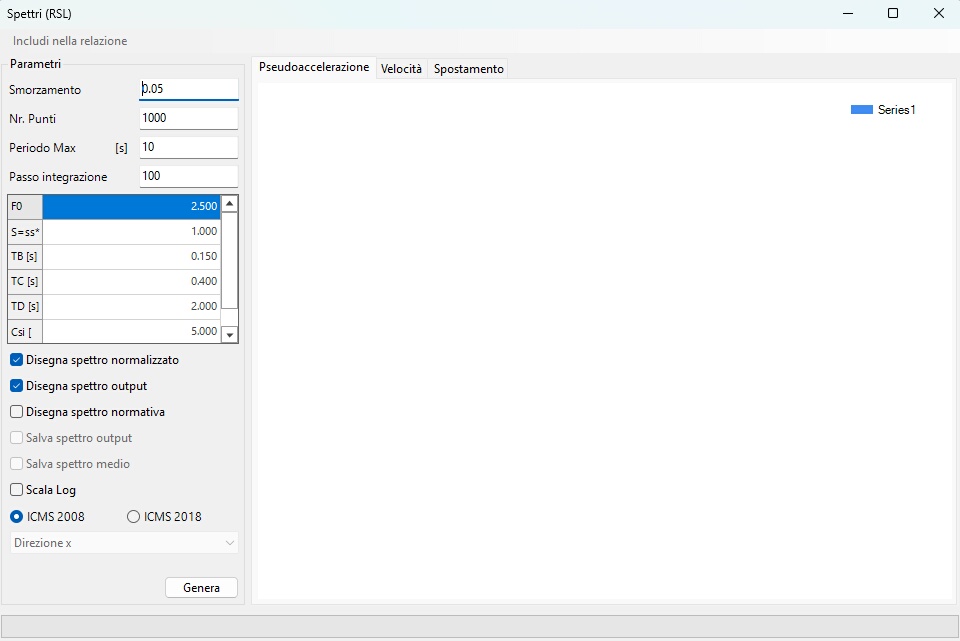
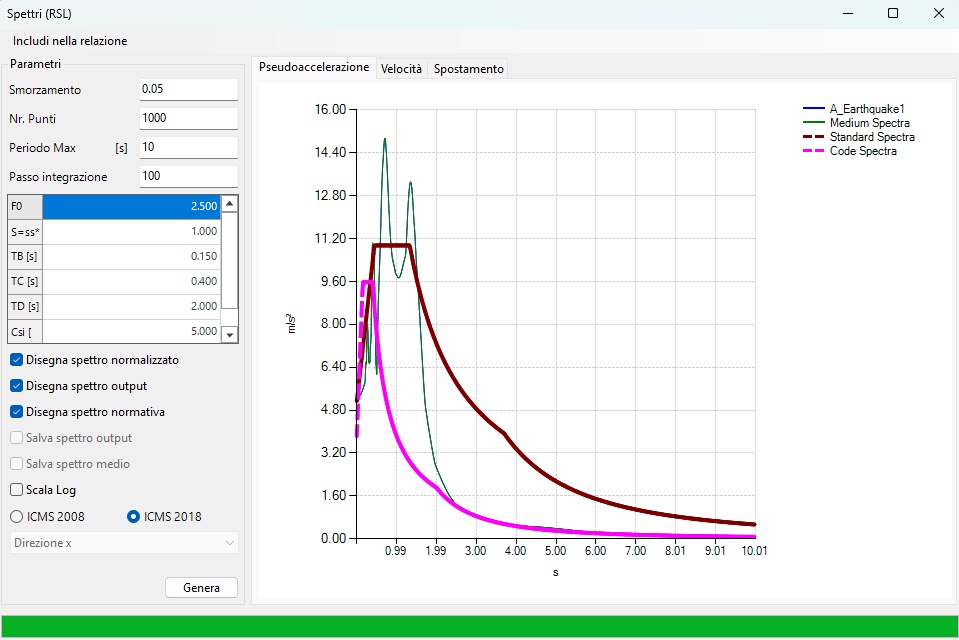
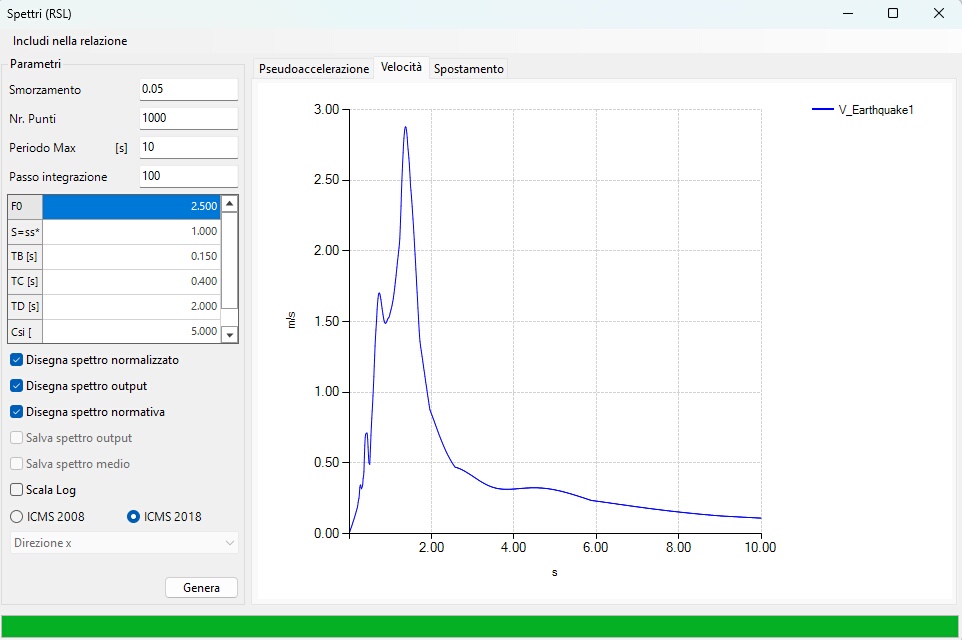
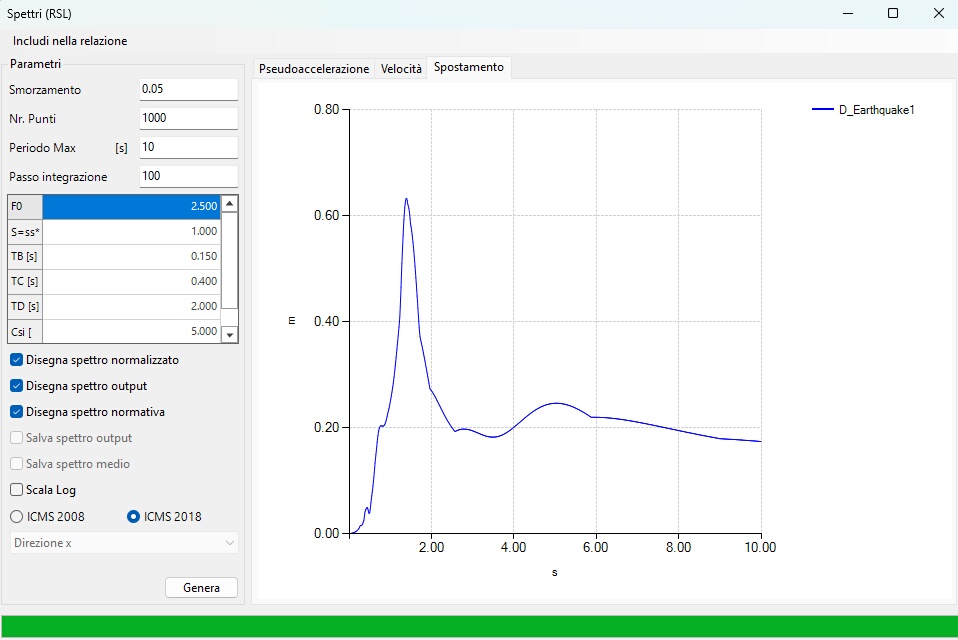
From this window it is possible to generate the output spectrum computed by the software, the normalised spectrum and the code spectrum, as a function of the required input parameters. By clicking on the "Generate" button, the spectra are displayed in terms of acceleration, velocity and displacement. Some examples are reported in the following figures.