Analysis types > Slope stability analysis > Computational example
The problem to be analyzed is a slope of Mohr-Coulomb material subjected to gravity loading. The factor of safety (FOS) of the slope is to be assessed, and this quantity is defined as the proportion by which friction angle and cohesion must be reduced in order to cause failure with the gravity loading held constant. Figure 52 shows the data for an analysis of a homogenous slope with the following material properties given in Table 5. The change in the volume during the failure is not considered in this study and therefore the dilation angle ψ is taken as zero.
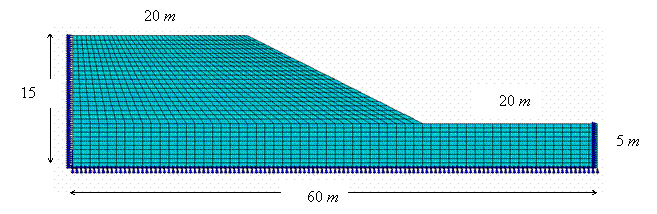 |
| Fig. 52. Mesh and data for slope-stability example. |
Table 5. Material properties
| E [kN/m2] | ν | γ [kN/m3] | ϕ [degree] | C [kN/m2] | ψ [degree] |
| 1x10⁵ | 0.3 | 20 | 20 | 15 | 0 |
Gravity load is applied to the model and the strength reduction factor (SRF) gradually increased affecting the equation (104) until convergence could not be achieved.
The output in Table 6 gives the strength reduction factors and the associated maximum nodal displacement at convergence, and the number of iterations to achieve convergence.
Table 6. Summarized results of slope stability analysis.
| SRF | Number of iterations | Maximum displacement [cm] | Convergence |
| 1 | 10 | 1.710982 | OK |
| 1.1 | 13 | 1.789119 | OK |
| 1.2 | 17 | 1.889358 | OK |
| 1.3 | 22 | 1.996587 | OK |
| 1.4 | 35 | 2.116528 | OK |
| 1.5 | 82 | 2.29019 | OK |
| 1.6 | 600 | 4.118373 | FAILED |
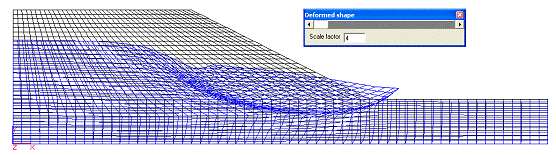
It can be seen that when SRF factor is equal with 1.6 the iteration ceiling of 600 was reached. Figure 53 shows a plot of these results and it can be seen that the displacements increase rapidly at this level of strength reduction, indicating a factor of safety of about 1.6. Bishop and Morgenstern charts give a factor of safety of 1.593 for the slope under consideration. Figure 54 shows the deformed mesh and displacement vectors corresponding to slope failure; the mechanism of failure is clearly shown to be of the "toe" type.
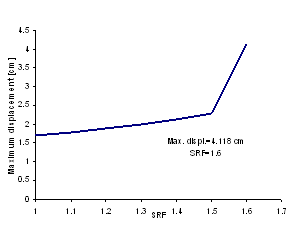 |
| Fig. 53. Maximum displacement versus Strength Reduction Factor. |
 |
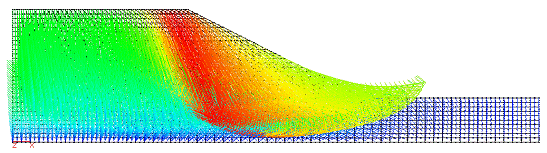 |
| Fig. 54. Deformed mesh and displacement vectors at failure. |
 |
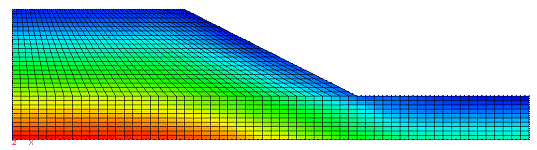 |
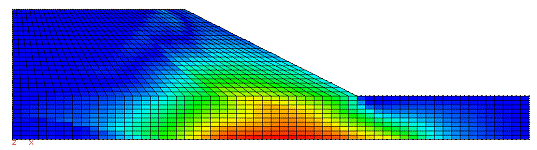
| Fig. 55. Maximum Shear Stresses and Von-Misses Stresses. |
© GeoStru Software