Analysis types > Bearing capacity analysis
Plane strain conditions are enforced and in order to monitor the elasto-plastic behavior, the loads are increased incrementally until the collapse occur. The method uses constant stiffness iterations, thus the relatively time consuming stiffness matrix factorization process is called just once, while the backward substitution phase is called at each iteration. Several failure criteria have been implemented for representing the strength of soils as engineering materials. For soils with both frictional and cohesive components of shear strength Mohr-Coulomb failure criteria is appropriate. For undrained clays, which behave in a "frictionless" manner, Von-Misses failure criteria may be used.
The example shown in Figure 56 is of a flexible strip footing at the surface of a layer of uniform undrained clay. The footing supports a uniform stress q, which is increased incrementally to failure. The elasto-plastic soil is described by the Von-Misses failure criteria and is described by three parameters, namely the undrained "cohesion" cu, followed by the elastic properties E and ν. The loads in this case are the nodal forces which would deliver a uniform stress of 1kN/m2 (q=1kN/m2) across the footing semi-width of 2 m..
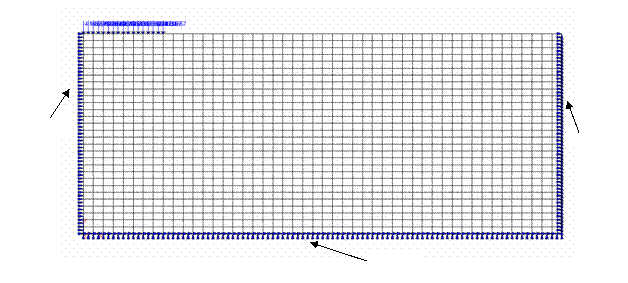 |
| Fig.56. Mesh and data for bearing capacity example. |
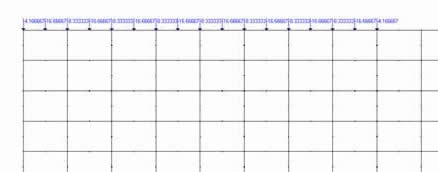 |
| Fig.57. Nodal forces |
Table 7. Material properties
| E [kN/m2] | ν | Cu [kN/m2] |
| 1x10⁵ | 0.3 | 100 |
Table 8. Summarized results of bearing capacity analysis.
| Applied load factor | Number of iterations | Convergence |
| 0.2 | 2 | OK |
| 0.8 | 2 | OK |
| 1.0 | 2 | OK |
| 2.0 | 2 | OK |
| 2.8 | 17 | OK |
| 3.0 | 26 | OK |
| 3.6 | 41 | OK |
| 4.0 | 50 | OK |
| 4.4 | 66 | OK |
| 5.0 | 123 | OK |
| 5.2 | 300 | FAILED |
Figure 58 show the deformed mesh and displacement vector corresponding to unconverged solution at collapse.
 |
| Fig. 58. Deformed mesh and displacement vectors at failure. |
These loads are "factorized" by the increasing load factors from 0.1 till ultimate load factor corresponding to collapse. At load levels below failure convergence should occur in relatively few iterations. As failure is approached the algorithm has to work harder and requires more iterations to convergence. The output in Table 8 gives the applied load factors and the associated and the number of iterations to achieve convergence.
 |
 |
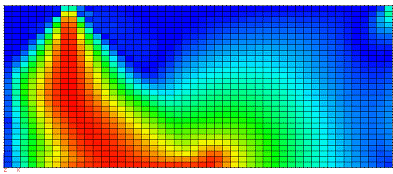
| Fig.59. Maximum Shear Stresses and Sigma-X Stresses at failure. |
© GeoStru Software
.