Spectral analysis
The phase of the spectral analysis is needed to determine the experimental dispersion curve. The software performs this analysis using the double discrete Fourier transform, applied to the variables of time and space.
It allows two types of analysis:
- generation of the phase velocity-frequency spectrum;
- generation of the wave number-frequency spectrum.
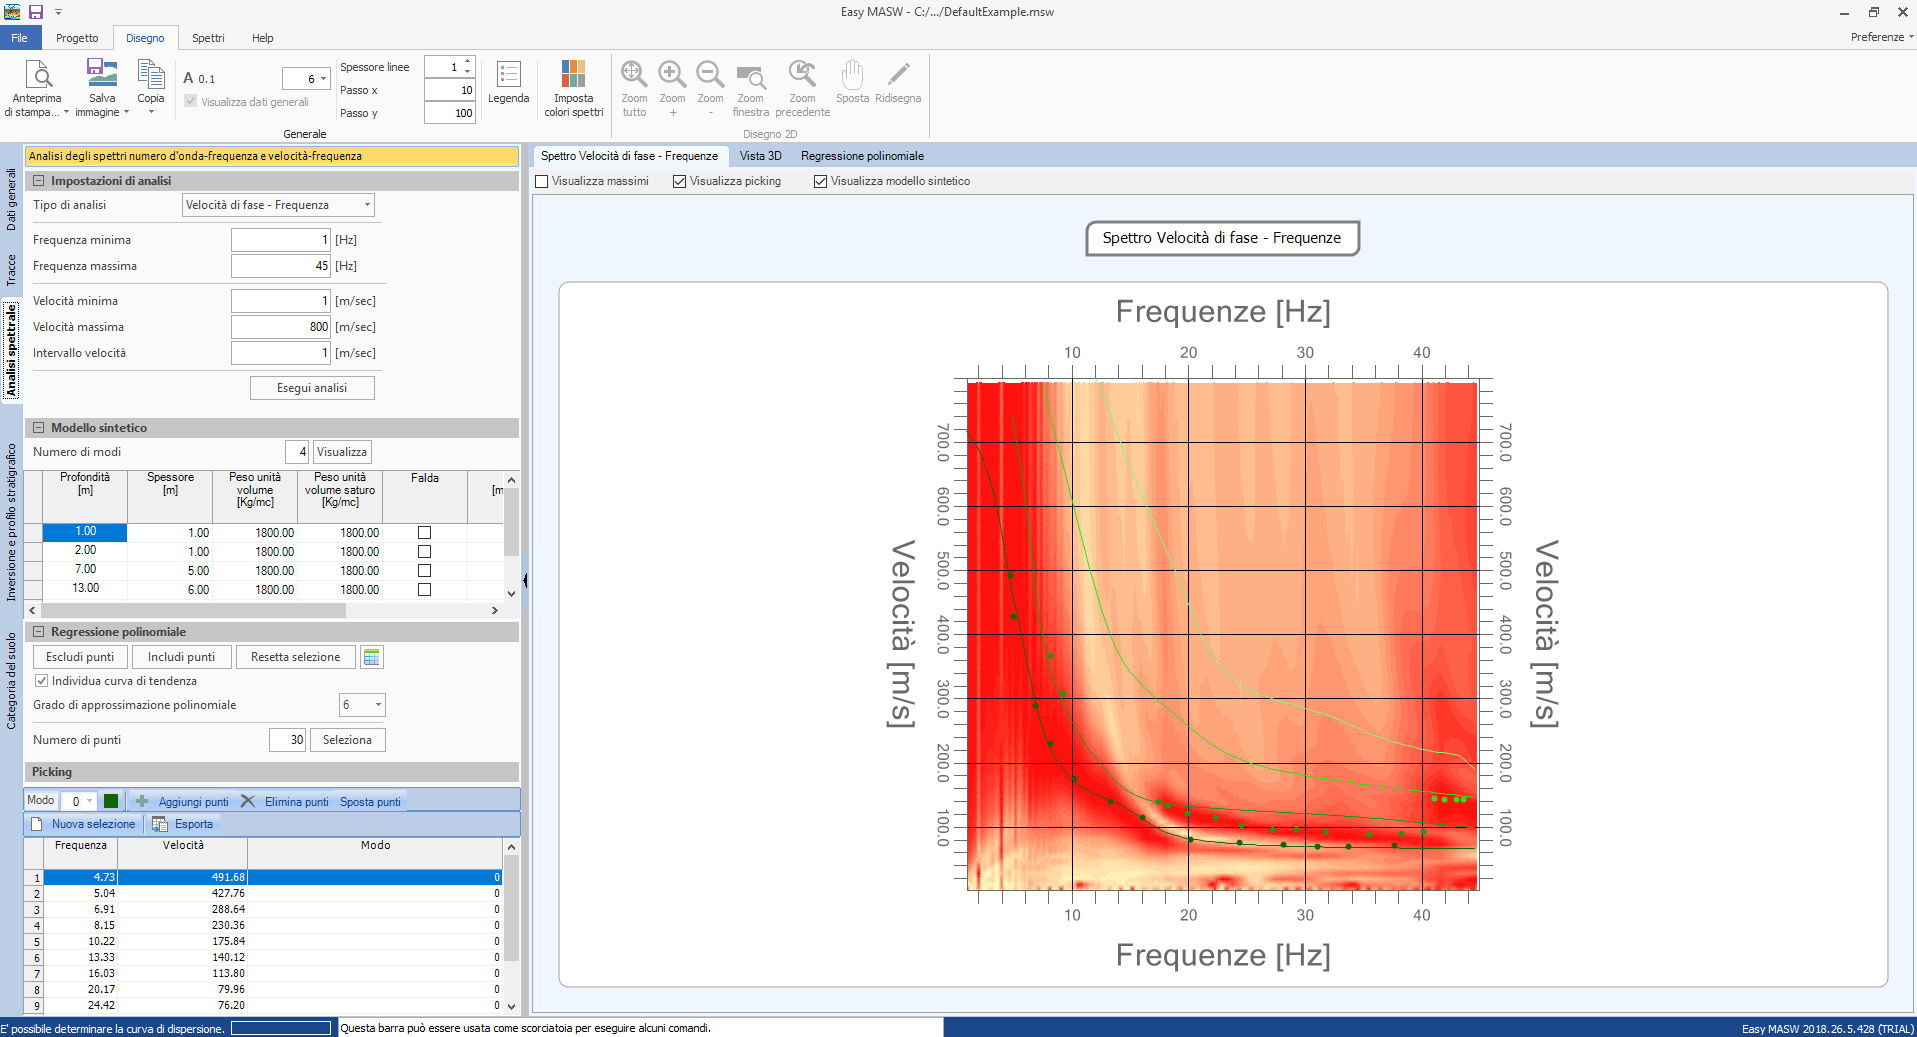
To perform the analysis with the phase velocity - frequency spectrum the following parameters can be set:
- minimum frequency of research;
- maximum frequency of research;
- minimum speed of research;
- maximum speed of research;
- speed range to consider in the analysis. A note about the maximum frequency of research
The maximum frequency of the research is fixed according to Nyquist's theory on the discrete Fourier transform by the relation 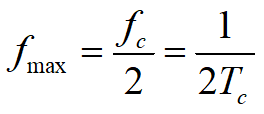 where fc is the sampling frequency of the instrument that corresponds to the inverse of the sampling period Tc
To conduct a thorough analysis, the program allows the user to define a preliminary model of the terrain through which it is possible to visualize the dispersion curve directly on the processed spectrum of velocity-frequency. In the preliminary model, the last layer is always considered as infinite half-space, therefore the thickness can also be set to zero.
The synthetic (preliminary) model is optional
The ground model you can enter here only serves to overlay a trial theoretical dispersion curve on the spectrum, as a visual aid to recognise the modes and guide the picking. It is not mandatory and it is not the solution: you can leave it empty and proceed with the picking anyway. The real stratigraphy will come from the inversion. Entering it is useful when you want to check a ground hypothesis or understand how the modes are arranged, but you can do without it.
On this spectrum are identified also a set of points for the fundamental mode (mode 0) and for the higher modes (up to mode 4). The selection can be made only for the modes clearly ascertainable from spectral analysis.
The result of the selection is always summed up in the grid where all the results of identified modes are gathered.
The selection phase is being started by pressing the "Add points" button and ends by deselecting it. The points then can be moved and deleted by acting on the diagram or data grid. On the chart you can plot the maximums determined for each frequency of the processed spectrum.
Maxima and picking: how to use them together
The maxima are the points of maximum energy automatically detected for each frequency: they are a guide-track showing where the ridges run. The picking, instead, are the points that you confirm and that will feed the inversion. The recommended way of working is to switch on the display of the maxima and then pick along them, correcting by hand where the maxima are uncertain (weak modes or noisy signal). Remember to select the correct mode (0 = fundamental, 1, 2… = higher modes) before adding the points of a ridge.
When you move the mouse on the diagram the information related to the corresponded point is shown.
The "Polynomial regression" section can be a convenient tool in the phase of discovering points to use for the inversion. Enabling this menu, the maximums processed in spectral curve are plotted on the diagram with the trend curve that they identify. The user can choose the degree of the polynomial regression and the points to include in the computation. To exclude some points from the computation is enough to select the "Exclude points" button and draw on the diagram a window to confine the points to discard. Similarly, using the "Add points" button you can insert some excluded points in the regression computation.
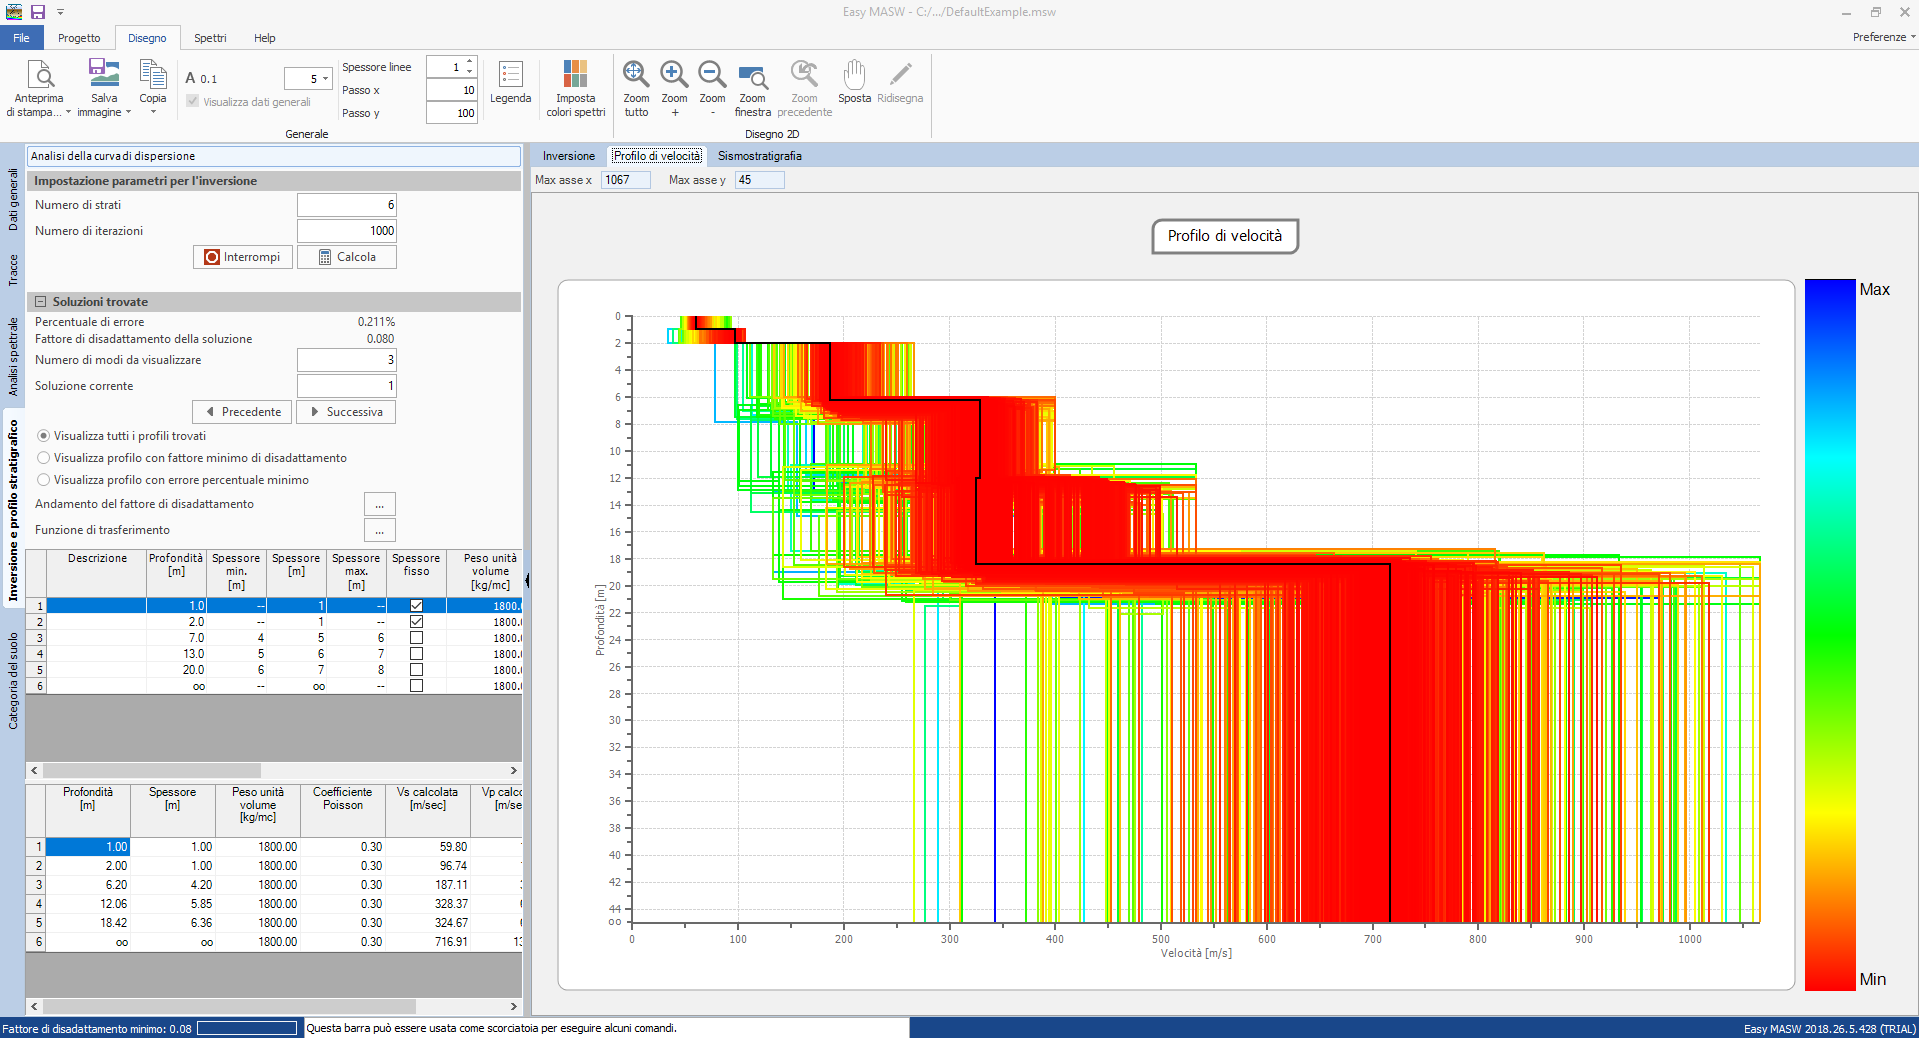
Using the regression curve, the software can choose a set of values to use during the inversion. It is good to note that the selected points are considered as points of the fundamental mode.
The values automatically identified are plotted on the spectrum so that the user can refine the selection both by inserting points related to higher modes as well as changing or deleting the ones already identified.
Other operations that can be made at this phase are:
- export the displayed images;
- fit the size of texts;
- operate on the charts with tools such as zoom, pan etc..;
- adapt graphics in full screen;
- display the three-dimensional graph of the spectra and apply the desired rotations;
- set the chart grid of spectra with a customized step.
© Geostru